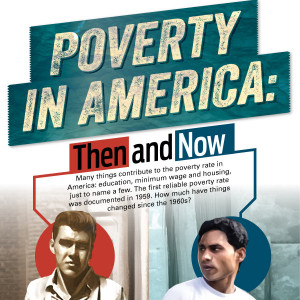
Poverty in America: Then and Now infographic summarizes the poverty rate in America and how education, minimum wage, and housing all contribute to the problem.
Poverty in America: Then and Now
Many things contribute to the poverty rate in America: education, minimum wage, and housing, just to name a few. The first reliable poverty rate was documented in 1959. How much have things changed since the 1960s?
Poverty Facts
- Total number of Americans below the poverty line
- 1960s: 39 million
- Today: 46.5 million
- Percentage of Americans below the poverty line
- The 1960s: 22%
- Today: 15%
Income
- Median household income (3,4)
- 1960s: $6,500 (2014 dollars: $51,524) (18)
- Today: $51, 371
- Income tax rates (mid-tier) (5)
- 1960s: 23%
- Today: 17%
- Minimum wage (6)
- 1960s: $1.29/hour (2014 dollars: $10.23/hour) (18)
- Today: $7.25/hour
- Unemployment rate (7)
- 1960s: 5.5%
- Today: 7.4%
Education
Literacy rates
- 1960s: 97%
- Today: 99%
High school completion (percentage of 25 or older population)
- 1960s: 42%
- Today: 80%
College completion (percentage of 25 or older population)
1960s: 8%
Today: 24%
Home Life
Average cost of a house
- 1960s: $20,000 (2014 dollars: $158,536)
- Today: $272,900
Average food costs
1960s
- Bread, $0.21 (2014 dollars: $1.66)
- Dozen eggs, $0.46 (2014 dollars: $3.65)
Today
- Bread, $1.29
- Dozen eggs, $1.69
Average gasoline costs
- 1960s – $0.35/gallon (2014 dollars: $2.77/gallon)
- Today – $3.64/gallon
Health care expenditures per capita
- 1960s: $147 (2014 dollars: $1,165)
- Today: $8,402
Marriage rates (of population 18 and older)
- 1960s: 72%
- Today: 51%
Government
Fixed poverty thresholds:
1960s
- Individuals, $1,500 per year (2014 dollars: $11,890)
- Families, $3,000 per year (2014 dollars: $23,780)
Today
- Individuals, $11,670 per year
- Families of four, $23,850 per year
Important legislation :
1960s
- Economic Opportunity Act (1964)
- Food Stamp Act (1964)
- Medicaid (1965)
- Amendments to Social Security (1965)
Today
- American Recovery and Reinvestment Act (20)
- Supplemental Nutritional Assistance Program (SNAP) (renamed in 2008)
- Affordable Care Act (2010)
Related Infographics:
- How Poverty Burdens the Brain
- Looking for Leaders: The Crisis in Social Work
- Romanticizing Poverty
- Smoke Without Fire
- Suicide Notes
- The Changing Demographics of the Welfare State
- The Faces of Homelessness Today
- The Social Impact Of Mixing Business & Medicine
- The State of Children’s Health
- The War Within: Sexual Abuse in the Military
- Who Needs Social Workers?


